New school shooting dashboard created by Tableau's 'Data for Good' award winner
New interactive data visualizations are a collaboration with The Information Lab to help people make data-driven decisions about school safety.
I’ll begrudgingly admit that not everyone gets excited to sort and filter an excel spreadsheet. The good news today is that anyone can select, manipulate, and visualize dozens of variables from the K-12 School Shooting Database in an interactive and user-friendly Tableau dashboard.
A Tableau dashboard is a visual display of data that provides an overview of key metrics, trends, and insights. It typically consists of multiple visualizations, such as charts, graphs, and maps, arranged on a single screen. Dashboards allow users to interact with and explore data, enabling them to make informed decisions quickly.
Quick tip: In the bottom right corner of the dashboard, you can click “see this in full screen” if the tiles, maps, and graphs are not scaling to your window.
You can access the new dashboard through Tableau Public or via my website:
Who is the Information Lab?
The Information Lab, also known as TIL, is a world wide business intelligence (BI) solutions consultancy group. TIL+ is an initiative from The Information Lab aimed at empowering NGOs with our data expertise. This new school shooting data dashboard was created at no cost and is available to any user for free.
Info Lab has been recognized by Tableau’s “Data for Good” award and the 2022 “Data for Good Champion” award from Data IQ, TIL+ is committed to help people make data-driven decisions that align with their socially-driven missions.
School Shooting Data Overview Tab
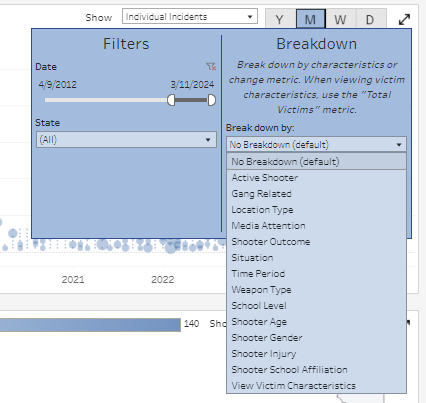
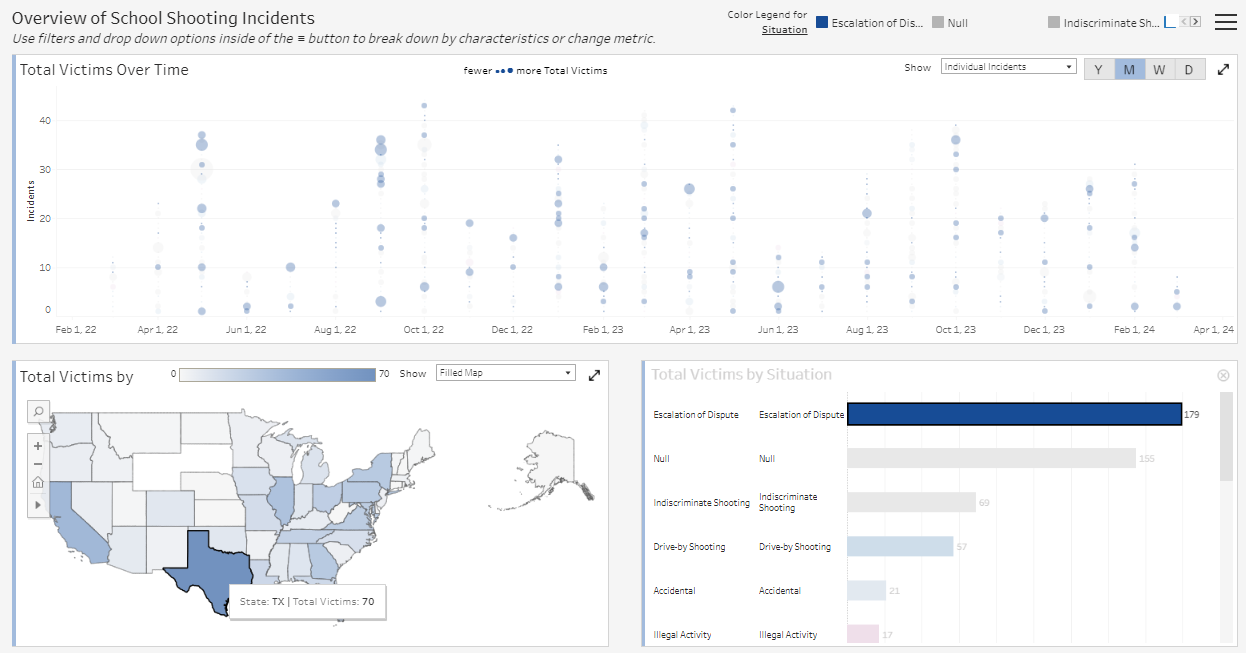
The overview of school shooting incidents lets you explore trends over time by years, months, weeks, or days. This data can be visualized as either a trendline or bubbles for each incident that increase in size based on the number of victims.
In the breakdown menu, you can filter by many of the variables in the K-12 School Shooting Database (see methodology for more info).
For example, you can filter by situation to see that “escalations of disputes” are the most common circumstance when a shooting occurs. The map uses a color gradient to show the fewest victims to the most victims. The darkest color state on the map is Texas where 70 victims were shot during escalations of disputes between 2022 and today. You can adjust the slide bar to select any range of dates.
Community Impact and Gun Legislation
In addition to the characteristics of each incident, you can also explore the community impact and state-level gun legislation. These dashboards were created by combining school shooting data with other open-source information such as US Census data.
To make comparisons between school shooting incidents and states, gun legislation was converted into a “restrictiveness index” from 1 to -1 that depends on the number and types of gun laws in each state.
To make apples to apples comparisons, state populations are normalized by using the number of incidents per 100,000 people.
Using the restrictiveness index and normalized population, you can see that Mississippi has some of the least restrictive gun laws and one of the highest rates of shootings on k-12 campuses per 100k people.
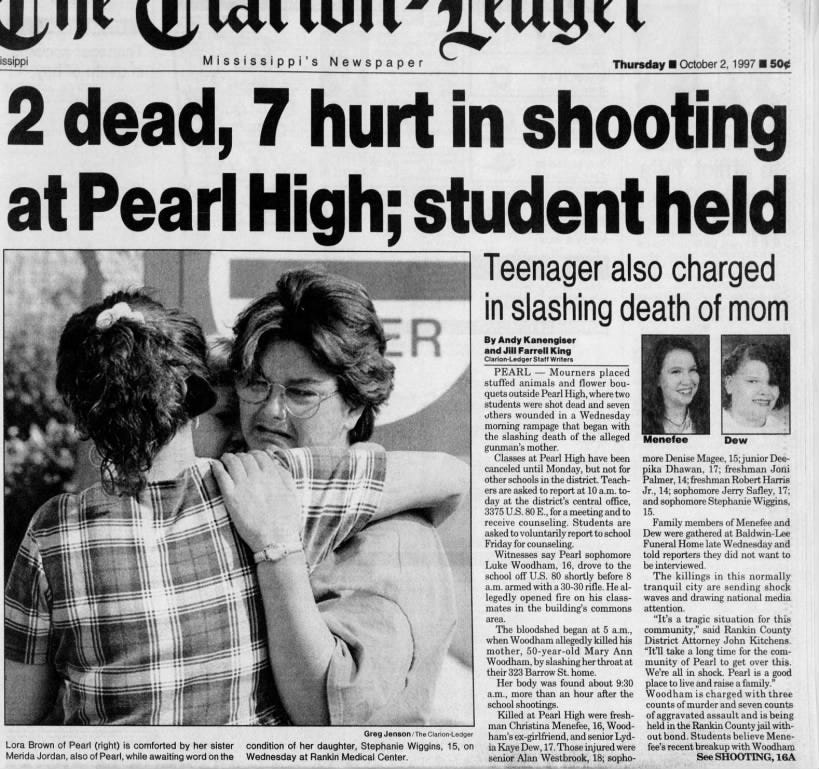
Looking at these new data dashboards can help provide context and background for understanding school shooting incidents. In 1997, a 16-year-old at Pearl High School in Pearl, MS carried a rifle into his school under a trench coat (note: school shooter wearing a trench coat two years before Columbine). He killed 2 and wounded 7 others before fleeing.
Following the school shooting, Mississippi passed a new state law to make a shooting on school property punishable by the death penalty. Mississippi did not pass any firearms related legislation.
Almost 30 years later, we know most school shooters are actively suicidal which means the death penalty is not a deterrent, it may be the objective. Inversely, gun storage laws that require unloaded guns to be locked in a safe can prevent a 16-year-old student—who is not old enough to purchase a firearm—from gaining access to a gun.
Feedback
Let me know what you think about this new Tableau dashboard.
If there are other datapoints, variables, or open-source data comparisons that you think would be useful to study and visualize, please email k12ssdb@gmail.com with your suggestions.
David Riedman is the creator of the K-12 School Shooting Database and a national expert on school shootings. Listen to my recent interviews on Freakonomics Radio, New England Journal of Medicine, and Iowa Public Radio the day after the Perry High shooting.


