Errors in school shooting threat reporting mandated by Texas law
Data entry errors caused a suburban waterfront community's elementary school to report the highest number of threats in the Houston Area. There are easy ways school districts can spot these problems.
Since the Santa Fe High school shooting in 2018, Texas requires schools to track reports of threats. A new investigation by KHOU in Houston discovered the numbers some schools reported have major errors.
For the 2023-2024 school year, William Travis Elementary in Goose Creek CISD, reported 290 threats involving violence or harm towards others. This is an elementary school with a ‘Gifted & Talented’ program and 800 students in a suburban waterfront community on Burnet Bay. Houses for sale just blocks from the school range up to $900,000.
This elementary school had more threats of violence than any other school in the Houston area. The numbers the school district reported would mean that 1/3 of the kindergarten through 5th grade students at the school made a threat of violence that year.
Goose Creek CISD said in a statement: “Each incident was inadvertently reported approximately 13 times instead of once, leading to inaccurate and inflated numbers.”
In nearby Klein ISD, there was also discrepancy in the numbers at Klein Collins High, which reported the most overall threats in the Houston area last school year.
The Klein ISD school police chief explained "an employee in charge of entering the data included everything flagged by monitoring software. That software flags words like kill, hurt, harm, violence. So if a student wrote a paper about the novel “To Kill a Mockingbird,” that was reported as a threat too."
Is this a nationwide problem? If these errors with data entry and data filtering occur in well-funded suburban school districts in Texas, are school shooting threats being misreported or miscounted elsewhere too?
I've been asking school districts and states that mandate threat reporting for anonymized spreadsheets of their data for years. Even after months of back-and-forth emails, no jurisdiction has been willing to share their threat data. Is this because they are worried about errors being discovered?
How to easily spot errors in data
How did a huge error like reporting 13x higher than the real total at William Travis Elementary go unnoticed? While most people roll their eyes when they hear the word “statistics”, these three basic elements from high school math class can show obvious errors in a spreadsheet.
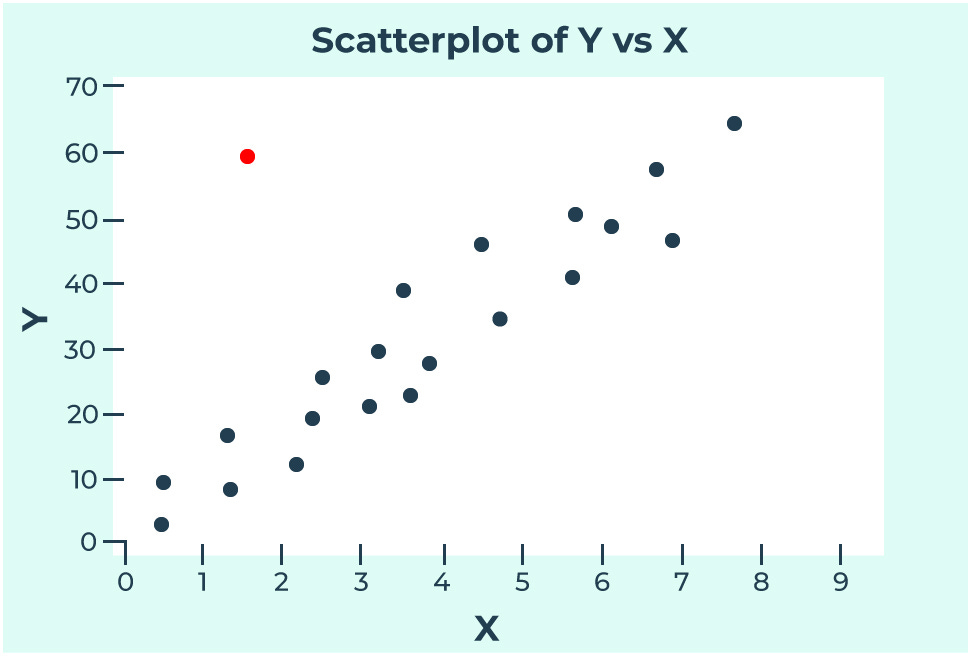
Mean (average): Total number of threats divided by the number of schools (or students). In this case, if William Travis Elementary reported 290 threats and most other similar elementary schools reported 10 to 20 threats, the mean across the district or region would suddenly spike upward. That’s an obvious red flag for an error in the data.
Inflated overall mean: If 10 schools each report ~15 threats and one school reports 290, the mean becomes inflated. A mean of 42.5 looks wildly out of sync because the mean that someone would expect is around 15. That alone should prompt a review.
Deviation from the mean: If you compare the number of threats at each school to the average from the total across the entire district, if William Travis Elementary reported 290 threats, that would be 6x higher than the aggregate mean. That shows a problem!
Median (middle point or central tendency): Value that lies in the middle when all values are arranged from least to greatest. Unlike the mean, the median is less sensitive to outliers, which makes it an easy way to detect anomalies.
Deviation from median: Using the same 10 schools, if 9 report between 10–20 threats, and one reports 290, the median is still be about 15.
Extreme outliers: If the median is 15 and the mean is 42.5, that discrepancy signals that one or more schools are reporting outliers.
Mode (most common value): Value that occurs most often. If the majority of schools report 0, 1, or 10 threats, and suddenly one school has a number like 290, it's obviously an outlier.
Distance from most common value: In generally quiet and peaceful suburban elementary schools, if the mode is 0 or 1 threats per school year because that value gets most often reported, there is probably an issue with data when one schools reports 290 threats.
This doesn’t require any complicated software or expert analysis. If these school districts plotted their threats data and it looked like the chart on the right, it’s immediately obvious that something is skewing the mean. If a simple distribution chart looks off, there is probably an error somewhere in the spreadsheet!
Beyond the mean, median, and mode, here are some other simple ways to spot errors with basic analysis of a spreadsheet.
Threats per student adjusted for school enrollment: This is a simple way to adjust for school size when comparing how many threats are reported across the entire school district. It’s calculated by dividing the number of reported threats by the number of students enrolled at the school.
This helps avoid misleading comparisons because reporting 50 threats at a school with 1,500 students isn’t the same as 50 threats at a school with 300 students. By adjusting for enrollment, you can spot which schools have a higher rate of incidents per student, not just the highest total number.
If threats/student were calculated, William Travis Elementary would immediately standout with a rate of .36 threats/students when the district average was closer to .03 threats/student.
Outliers in rank-ordered lists: Sort schools by number of threats. If one school reports 10× more threats than the others in the same grade level or district, that's likely an error.
Compare yearly totals: Big spikes or drops from one year to the next (e.g., 20 threats in 2022–2023 → 290 in 2023–2024) suggest either a data error or a change in reporting methods.
Check for duplication: If a school has lots of identical entries (same date, threat type, same wordings), it could mean the same incident was counted multiple times like with Goose Creek CISD recording the same threats 13 times each.
Compare across school levels: Common sense would suggest that elementary schools with young students generally report fewer threats than high schools. If an elementary school reports more threats than all the local high schools combined, something’s off.
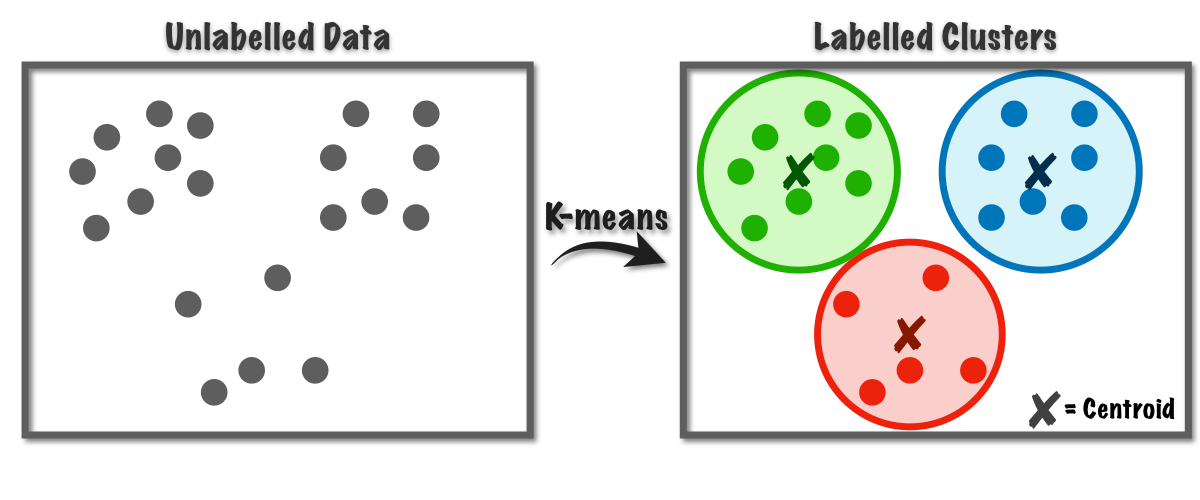
Data clusters: If dozens of threats are logged on the same day or week, it might be a data entry issue such as a single event being entered and counted many times. Instead of looking at every individual data point, you can examine the center (centroid) of each data cluster. The 290 threats reported for William Travis Elementary probably wouldn’t align with any of the other data clusters which makes a problem in the data entry immediately obvious.
Even if this sounds complicated, the good news is every school district employs math teachers who can easily complete this kind of basic data analysis. Analyzing the threats data from the district could even be a project for students in a high school math club. I’ve had multiple high school teachers reach out to me to request the school shooting data for class projects (just email k12ssdb@gmail.com if you are a teacher). One of the best ways to prevent gun violence at schools is to have students invested and involved in finding the solutions.
Note: The last option isn’t a joke. The Excel World Championship is on ESPN.
How many school shooting threats happen each year?
We don’t know how many school shooting threats happen each year because the federal government doesn’t collect this data. At the state level, few states mandate the collection of information about threats and those that do collect this info don’t make it available to the public. Without standardized reporting or a central way to collect the data, we are stuck guessing about the scope of this problem.
Trying to replicate the open-source data collection that I use for the K-12 School Shooting Database isn’t viable because there are too many threats, they are inconsistently reported, and news stories usually don’t have enough detail to determine if they are legitimate or hoaxes. I helped write a peer-reviewed paper about this issue based on a small-scale study of 1,000 threats.
K-12 Dive (2023): Real or hoax? Intention of 40% of school shooting threats unknown
Although there has been research about school shootings and behavioral threat assessments, I was the co-author of the only peer-reviewed empirical study of school shooting threats.
We examined 1,000 school shooting threats over four school years from 2018 through 2022. There is no government agency that collects, reviews, and reports on school shooting threats, so the study’s researchers used Google News alerts to find news reports about shooting threats to K-12 schools in the U.S. over that four-year period.
One finding from the study was that the most common outcome when a person made a threat was that the individual was arrested and charged with a felony. For nearly 80% of cases with known outcome data, 63.7% of the cases showed the person making the threat was arrested. When arrests were made, in 87% of the cases, the person was charged with a felony.
These are great number to cross reference with threats data because the 290 reported threats at William Travis Elementary should have resulted in about 250 felony arrests which would show up in local and state crime data. If the reported threats didn’t match the crime data, that’s a sign of a reporting error.
My peer-reviewed study. Peterson, J., Densley, J., Riedman, D., Spaulding, J., & Malicky, H. (2024). An exploration of K–12 school shooting threats in the United States. Journal of Threat Assessment and Management, 11(2), 106–120. https://doi.org/10.1037/tam0000215
David Riedman is the creator of the K-12 School Shooting Database, Chief Data Officer at a global risk management firm, and a tenure-track professor. Listen to my weekly podcast—Back to School Shootings—or my recent interviews on Freakonomics Radio, New England Journal of Medicine, and my article on CNN about AI and school security.


